The performance of the rate-based congestion framework using TRUMP/RBCC has been compared against TCP Reno and TCP Vegas in a set of hand-designed network scenarios with specific congestion problems. It may be argued that this small set of scenarios does not fully test the framework, and that a wider range of scenarios should be tried.
In this chapter I discuss the testing of the framework on a set of 500 randomly generated network scenarios. Both TCP Reno and TCP Vegas are also simulated on these scenarios to allow for comparisons of simulation results.
The 500 network scenarios were pseudo-randomly generated![[*]](footnote.gif) by a small Perl script. Each scenario contains 9 routers,
15 sources and 15 destinations. The 9 routers are randomly interconnected
to form a single network, and the 15 sources and destinations are randomly
connected to the routers.
by a small Perl script. Each scenario contains 9 routers,
15 sources and 15 destinations. The 9 routers are randomly interconnected
to form a single network, and the 15 sources and destinations are randomly
connected to the routers.
Each source transmits 1,500 packets of 1,500 octets to its destination, and the start time for each source is distributed evenly over the interval 0:100 seconds.
In order to increase the probability of network congestion, the overall bit rates and latencies for the links in each scenario were chosen as follows. There is a probability of 0.6 that a link is fast: fast links have capacities spread evenly over 1,000,000:10,000,000 bits per second and latencies spread evenly over 100:10,000 microseconds. If a link is not fast, it is slow: slow links have capacities spread evenly over 32,000:250,000 bits per second and latencies spread evenly over 10:5,000 milliseconds.
All other network scenario parameters are the same as the values given in Section 9.1. Details on how to obtain the 500 generated network scenarios are given in Appendix G.
As the amount of data obtained from the simulation of 500 network scenarios is overwhelming, a small set of measurements were abstracted from each simulation which describe the level of network congestion and performance in the simulated scenario.
The set of abstracted measurements are:
In each simulation there is a router which has the highest average buffer queue length. This router is the most congested node in the network. A perfect congestion control scheme will keep the average queue length for even the most congested node at 1 packet. Figure 53 shows the distribution of the highest average queue lengths.
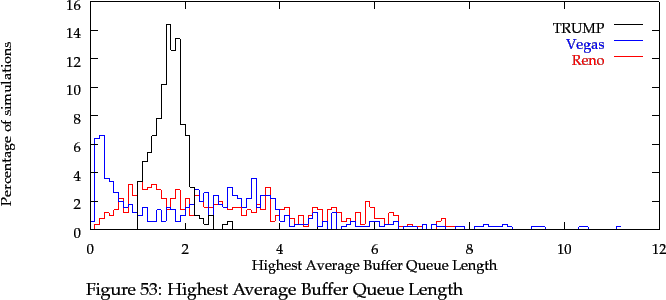
In the 500 scenarios simulated, TRUMP/RBCC keeps the average queue length close to 1 packet. The median of TRUMP/RBCC's distribution is 1.69, and 90% of the distribution falls in the range 1.12:2.13 queued packets. The distribution of highest queue lengths for Reno and Vegas is more widely spread. The median of Reno's distribution is 2.62, and 90% of the distribution falls in the range 0.45:5.99 queued packets. The median of Vegas' distribution is 2.46, and 90% of the distribution falls in the range 0.05:5.43 queued packets.
Clearly, TRUMP/RBCC is attempting to keep bottleneck routers near an optimum queue length of 1, thus ensuring that bottleneck links are utilised but not congested. TCP, on the other hand, either does not attempt to utilise bottleneck links, or overloads them, resulting in congestion. The results for packet loss and link utilisation, given below, reinforce this result.
The distribution of average queue lengths per simulation is shown in Figure 54. Even for non-bottleneck routers, TRUMP/RBCC attempts to keep queue lengths close to 1 packet, with a distribution median of 0.79 and with 90% of the distribution in the range 0.43:1.12 queued packets.
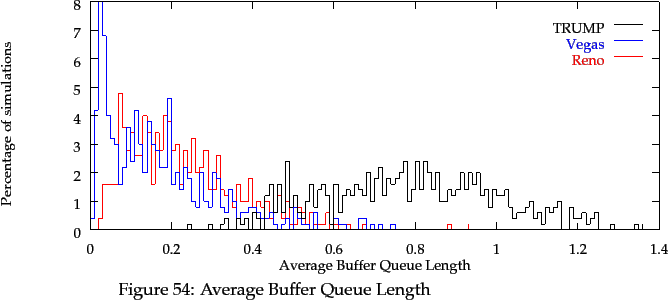
Surprisingly, the two TCP distributions fall below that of TRUMP/RBCC. Reno's distribution median is 0.20 with 90% of the distribution in the range 0.03:0.43 queued packets, and Vegas' distribution median is 0.14 with 90% of the distribution in the range 0.01:0.38 queued packets. It shows that TCP does not make full utilisation of the network's available capacity, and so routers are often under-utilised. Again, this assertion is reinforced by the link utilisation results given below.
The total packets lost in each simulation demonstrates quite clearly if the simulated network is suffering congestion, and to what extent. A perfect congestion control scheme will prevent any packets from being lost.
Each of the 500 randomly-generated scenarios has 9 routers and 15 traffic flows
generating 1,500 packets. Therefore, there must be at least
![]() data packets to be sent in the set of 500 scenarios.
For TCP and TRUMP, each data packet is acknowledged. Therefore, the 500
scenarios must deliver at least 22,500,000 packets, not including handshaking
(connection setup) packets, and retransmissions.
data packets to be sent in the set of 500 scenarios.
For TCP and TRUMP, each data packet is acknowledged. Therefore, the 500
scenarios must deliver at least 22,500,000 packets, not including handshaking
(connection setup) packets, and retransmissions.
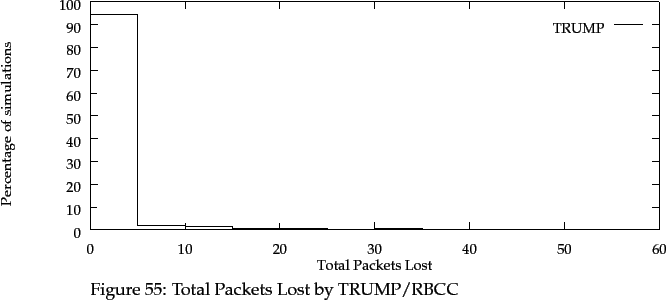
The distribution of total packets lost per simulation by TRUMP/RBCC is shown in Figure 55. This is an excellent distribution for packet loss, skewed towards 0 packets lost per scenario. The median of the distribution is actually 0 packets lost. In fact, 458 out of 500 scenarios simulated lost no packets whatsoever. Out of the minimum 22,500,000 packets admitted into the network, TRUMP/RBCC lost only 551 packets, a loss of roughly 0.002%
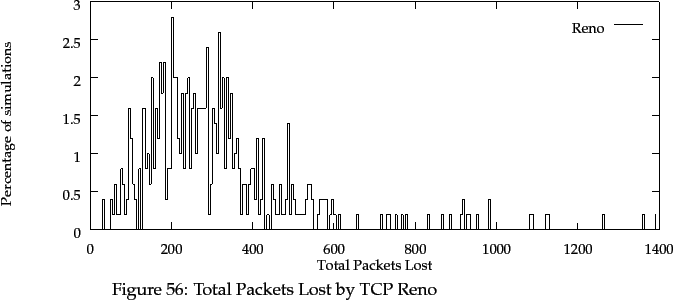
TCP Reno, on the other hand, shows a very disappointing distribution of packet loss. In fact, all of the 500 simulated scenarios lose packets with TCP Reno. The median of the distribution is 274 packets lost, with 90% of the distribution in the range 75:547 packets lost. TCP Reno loses 155,833 packets in total over the 500 scenarios. Clearly, TRUMP/RBCC provides much better congestion control than TCP Reno, based on packet loss alone.
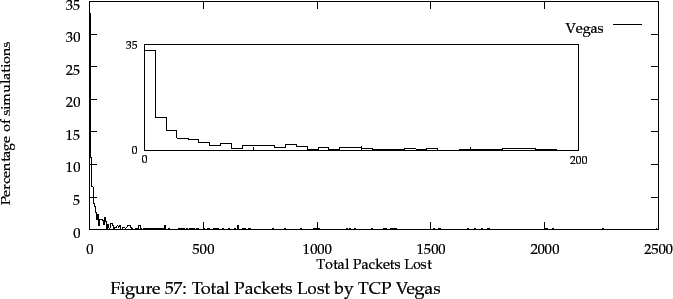
TCP Vegas shows better packet loss than TCP Reno, with a median of 14 packets lost and a 90% range of 0:396 packets lost. 97 out of 500 scenarios simulated lost no packets whatsoever. However, in some scenarios, TCP Vegas lost more packets than both TRUMP/RBCC and TCP Reno; the worst per-scenario packet loss was 2,491 packets. The total packet loss over the 500 scenarios was 70,111 packets. Clearly, in some situations, Vegas is very poor at congestion control.
In all networks, there is at least one link which should be fully utilised, as it is the bottleneck in the network. A perfect congestion control scheme will ensure that this link is fully utilised, so as to ensure the best throughput for the sources limited by the bottleneck.
The distribution of highest average link utilisation per simulation is
shown in Figure 58. Clearly, TRUMP/RBCC keeps the bottleneck
link at a high utilisation. The distribution has a median of 0.93 with
90% of the distribution in the range 0.84:0.99.
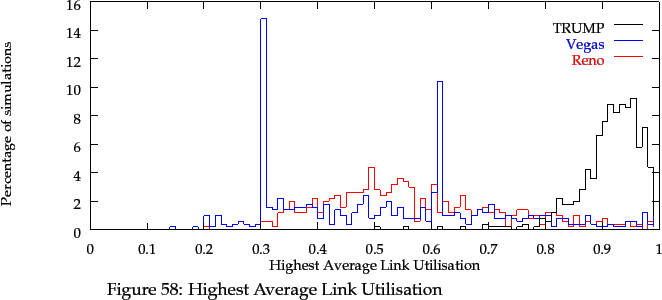
TCP Reno poorly utilises the bottleneck link. Its distribution has a median of 0.55 with 90% of the distribution in the range 0.33:0.82. Thus, sources using Reno achieve lower throughput than with TRUMP/RBCC. Similarly, TCP Vegas show poor bottleneck utilisation with a median of 0.53 and a 90% range of 0.26:0.87, which is close to Reno's distribution. I have no explanation for the two large spikes in the Vegas distribution at 30% and 61% utilisation.
Related to the utilisation of the network is the effective bit rate of each source: the total number of bits to be transmitted from a source application to a destination application, divided by the time taken to achieve this.
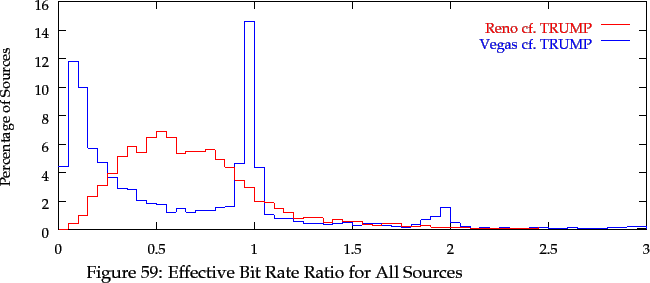
Figure 59 gives a histogram of the effective bit rate of
TCP Vegas sources compared to TRUMP sources (blue plot), and the effective
bit rate of TCP Reno sources compared to TRUMP sources (red plot). The
graph's x-axis is a ratio: at ![]() , a Vegas or Reno source achieved half
the effective bit rate of the corresponding TRUMP source.
, a Vegas or Reno source achieved half
the effective bit rate of the corresponding TRUMP source.
Clearly, TCP Reno generally achieves a lower effective bit rate than TRUMP, for all sources in the 500 random scenarios: only 15% of the Reno sources achieved a better effective bit rate than corresponding TRUMP sources. Given TRUMP's good link utilisation and low packet loss results, this affirms that TCP Reno underutilises network resources.
A large proportion of TCP Vegas sources achieved an effective bit rate equal to the corresponding TRUMP sources: 19% of the Vegas sources achieved a better effective bit rate than corresponding TRUMP sources. However, a significant proportion of TCP Vegas sources had worse effective bit rates than the TCP Reno sources. This result should be viewed in conjunction with Figure 60 below.
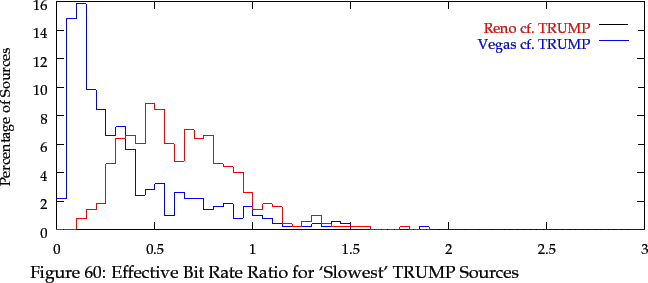
In this figure, only the ratios for the `slowest' TRUMP sources were used: the slowest TRUMP source achieved the lowest effective bit rate in each scenario.
TCP Reno sources exhibit a similar distribution of effective bit rates to Figure 59. TCP Vegas sources, though, achieve much lower effective bit rates than the slowest TRUMP sources. Taken with the Vegas result in Figure 59, this implies that some Vegas sources are being penalised, and have received an unfair allocation of bandwidth. In other words, Vegas' congestion control mechanism is unfair to some sources. This unfairness was observed in Scenario 5 in Chapter 9.
Although not important to network congestion, the end-to-end variance of sources is important to time-sensitive network traffic such as voice and video data transmission. Because the rate-based congestion control framework admits data uniformly into the network, end-to-end variance in the framework should be lower than for a window-based system such as TCP.
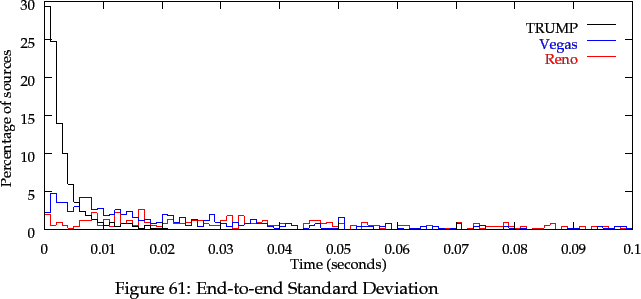
The end-to-end standard deviation distribution for all sources is shown in Figure 61. All TRUMP sources achieved an end-to-end standard deviation of less than 220 milliseconds, with 90% of the sources obtained a standard deviation less than 6 milliseconds.
90% of TCP Reno sources obtained a standard deviation less than 280 milliseconds, and 90% of TCP Vegas sources obtained a standard deviation less than 145 milliseconds. Clearly, the arrival times of TRUMP packets are more predictable than for TCP.
One of the requirements set down for the rate-based congestion control framework is that packet spacing should be preserved across the network. In the simulations presented, no work has been done to preserve this by the RBCC routers. Figure 62 shows the change in packet spacing from source to destination, for TRUMP, TCP Reno and TCP Vegas. The figure is a cumulative histogram; the x-axis gives a particular inter-packet spacing change in microseconds, and the y-axis shows the percentage of packet pairs with this change (or less) across the 500 random scenarios. For TRUMP/RBCC, there are 7.7 million inter-packet spacing changes; Reno and Vegas have more due to data retransmissions.
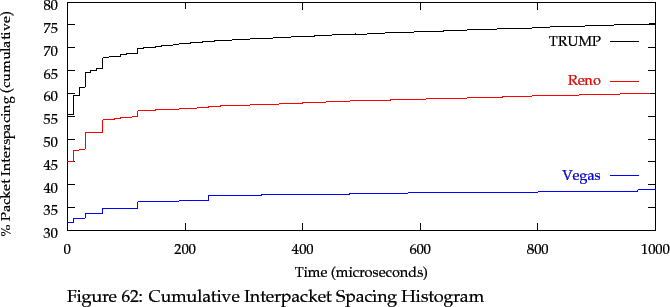
The figure shows that TRUMP/RBCC preserves inter-packet spacings well,
with no effort on its part. 53% of all TRUMP/RBCC packet pairs have
no measurable spacing change. This compares quite well to Reno (45%) and Vegas (32%).
87% of TRUMP/RBCC packet pairs have a spacing change less than 1 millisecond,
compared to Reno's 60% and Vegas' 39%.
The good spacing results for TRUMP/RBCC are due to the lower router queue lengths: this causes fewer packet delay variations due to queueing, and so spacing is preserved. Although it is desirable to further improve TRUMP/RBCC's inter-packet spacing results, they are clearly superior to TCP's, and should be quite acceptable to real-time data communications.
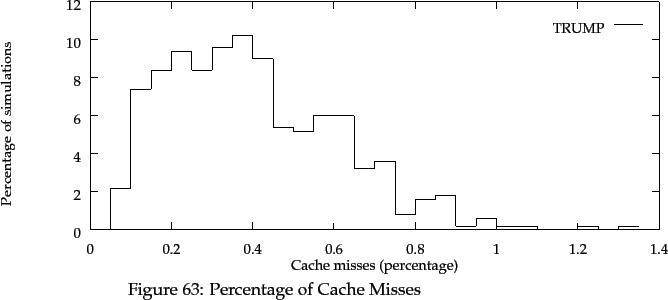
In Section 7.5, it was suggested that caching of congestion fields in packets should help to reduce the number of RBCC updates. Section 8.4 described the implementation of field caching in the REAL 4.0 version of RBCC.
Figure 63 shows the distribution of cache misses in the 500 random scenarios. Nearly all of the scenarios simulated kept their cache misses below 1%, and thus their cache hits above 99%. Caching appears to be an effective way of reducing the computational load of RBCC on the network's routers.
After caching has removed most potential ABT updates, there is little ABT work left as router overhead. The median for actual ABT updates is 214 updates per scenario (the total for all 9 routers), with the 90% range between 44:402 updates per scenario. The total number of ABT update operations for all 500 scenarios is 114,876. This is roughly 25 update operations per router for each scenario, a small amount of extra work per router.
In order to confirm that the simulation results of TRUMP/RBCC on a set of hand-picked network scenarios were not abnormal, TRUMP/RBCC was simulated on 500 pseudo-randomly generated network scenarios. As well, TCP Reno and Vegas were simulated on these scenarios to allow for comparisons of simulation results.
For each simulation, several key results were abstracted: this includes average router queue lengths, packets lost, link utilisation, throughput of slowest source and end-to-end variance. These were presented as a set of distributions for the 500 simulated scenarios.
TCP Reno was shown to be a poor network congestion scheme. Router queue lengths were very high, and packets were lost in all scenarios. In most scenarios, the packet loss was high. Link utilisation was very poor for the most congested link, and the sources generally achieved a lower effective bit rate than with TRUMP/RBCC. Finally, end-to-end variance and inter-packet spacing was high, which makes TCP Reno unsuitable for time-sensitive network traffic.
The congestion control of TCP Vegas is much better than TCP Reno, as packet loss is very much improved. However, in many respects, the performance of Vegas is similar to Reno: high router queue lengths, poor link utilisation and poor end-to-end variance. One serious drawback with TCP Vegas is its apparent unfair treatment of long path traffic flows with regards to available bandwidth: this problem alone should rule out the replacement of TCP Reno with TCP Vegas in the current Internet.
The results show that TRUMP/RBCC provides a very good congestion control scheme indeed. Router queue lengths were close to the ideal value of 1, even for severely congested routers. In over 90% of the scenarios simulated, no packets were lost, and very few packets were lost in other scenarios. Link utilisation for the most congested link was close to full utilisation. End-to-end variance and inter-packet spacing changes were very suitable for time-sensitive network traffic. Finally, with implementation techniques such as congestion field caching in routers, the overhead to implement the rate-based congestion control framework using TRUMP/RBCC appears to be low.