Testing of the rate-based congestion control framework was performed on a number of hand-crafted network scenarios, as well as a large number of pseudo-randomly generated scenarios. The hand-crafted scenarios are described here.
The purpose of testing TRUMP/RBCC on hand-crafted scenarios is to demonstrate its behaviour where the points and severity of congestion can be determined in advance. As well, specific characteristics of the framework (such as fairness, ability to deal with route changes, ability to work with desired rates from sources) can be checked.
Nine scenarios with different characteristics were crafted:
Nearly all scenarios use the same global parameters (the real_params sections shown in Appendix E). The most important parameters are given below:
Scenarios which do not use the parameters given above will be noted. The REAL input files containing these scenarios are given in Appendix E.
In this chapter, a per-source table of results will be given for each scenario. The columns in the table hold:
Scenario 1 is shown in Figure 16:
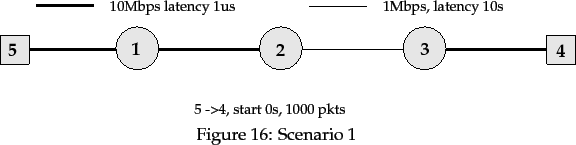
This simple scenario is designed to show the transmission characteristics
of the different transport protocols when there are no conflicting sources.
The low-speed link 2 ![]() 3 will limit the data rate of the data
source at node 5. Router 2 may need to buffer packets if the source of traffic
tries to exceed the available bandwidth.
3 will limit the data rate of the data
source at node 5. Router 2 may need to buffer packets if the source of traffic
tries to exceed the available bandwidth.
Throughout this chapter, diagrams of network scenarios show squares as hosts, circles as routers, thick lines as high-speed links and thin lines as low-speed links. The speed and latency of each link is also given, as is the start time and number of data packets in each traffic flow.
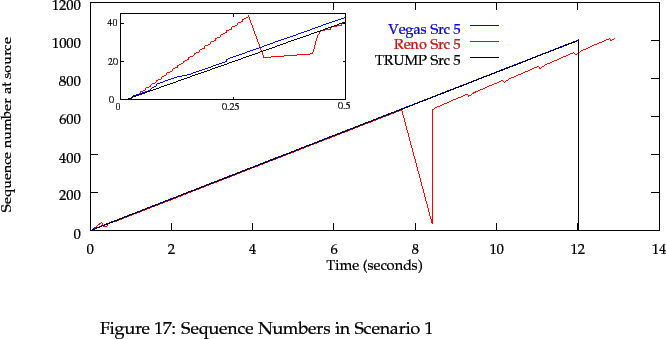
With all source types, node 5 begins transmission at 0 seconds. With TRUMP, the return handshake packet from node 4 reaches 5 at time 0.0109 seconds with a Return Rate value of exactly 1Mbps. Node 5 transmits data packets at this rate until time 12.0109, as shown in Figure 17.
TCP Reno does not perform a handshake, and begins data transmission at
0 seconds![[*]](footnote.gif) .
Acknowledgment packets open the window size (and hence the
transmission rate) until a packet is lost by router 2 at time 0.154.
The negative acknowledgment reaches the source at time 0.319, and it lowers
its window size from 23 packets back to 14. Reno transmits data packets
until time 12.912.
.
Acknowledgment packets open the window size (and hence the
transmission rate) until a packet is lost by router 2 at time 0.154.
The negative acknowledgment reaches the source at time 0.319, and it lowers
its window size from 23 packets back to 14. Reno transmits data packets
until time 12.912.
TCP Vegas also does not perform a handshake, and begins data transmission at
0 seconds. Its data transmission rate curve is extremely similar to TRUMP's,
except for some small deviations before time 0.3. Data transmission continues
until time 12.018.
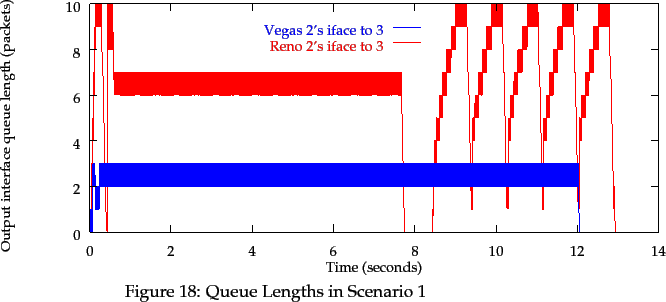
For TRUMP, buffer queue lengths in routers 2 and 3 never exceed 1 packet. No packets are dropped by any router. With Reno, buffer queue lengths in router 2 reaches the maximum value of 10 data packets several times as shown in Figure 18. Overall packet loss is 18 packets, all dropped by router 2. With Vegas, no packets are lost by any router, and the buffer queue length in router 2 sits at between 2 and 3 data packets for nearly all of the transmission time.
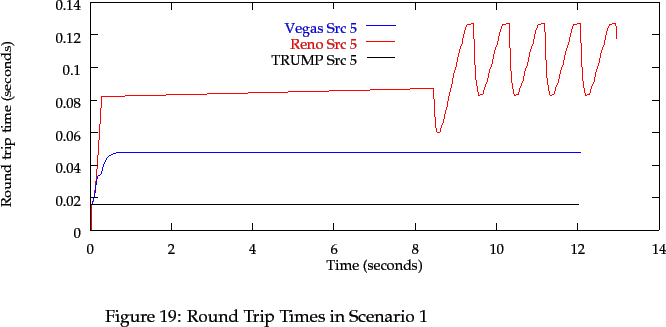
The round-trip time for all TRUMP acknowledgments is 0.016 seconds, as shown in Figure 19. The round-trip time for Reno oscillates between 0.083 and 0.126 seconds, reflecting the queue size in router 2. In Vegas, the round-trip time rises quickly from 0.016 seconds to 0.047 at time 0.6, and maintains a constant value of 0.048 for most of the transmission time.
In summary, TRUMP and Vegas do not lose packets in Scenario 1, but Reno does. TRUMP's and Vegas' data rates are extremely similar; Vegas, however, maintains a higher queue size in router 2, and this is reflected in the higher round-trip time.
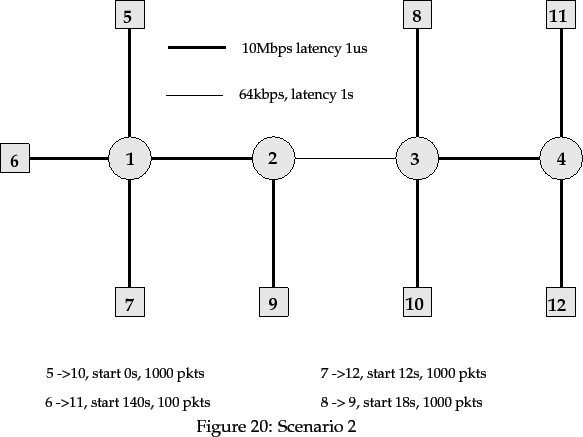
Scenario 2 is shown in Figure 20:
The scenario shows a number of nodes connected by full-duplex links.
All links have a data rate of 10Mbps, except for the link between
routers 2 and 3, which is a 64kbps link. The 10Mbps links have a latency
of 1 ![]() sec, and the 64kbps link has a latency of 1 second.
The latter latency, although unrealistic, serves to set the overall
round-trip time of this small network to that which is often experienced in a
global-scale network.
sec, and the 64kbps link has a latency of 1 second.
The latter latency, although unrealistic, serves to set the overall
round-trip time of this small network to that which is often experienced in a
global-scale network.
There are four data flows, 5 ![]() 10, 6
10, 6 ![]() 11,
7
11,
7 ![]() 12 and 8
12 and 8 ![]() 9. All cross the 64kbps link, but
all start at different times. Thus the link between routers 2 and 3 is the
bottleneck in the scenario, and should cause congestion in those routers.
9. All cross the 64kbps link, but
all start at different times. Thus the link between routers 2 and 3 is the
bottleneck in the scenario, and should cause congestion in those routers.
Note that all data flows have corresponding acknowledgment flows in the
reverse direction. Note also that the data flow 8 ![]() 9 is in the
reverse direction to the other data flows.
9 is in the
reverse direction to the other data flows.
Given Scenario 2, it is simple to compute the optimum rates for
each of the sources; the calculations are given in
Appendix F. The following table summarises the rates;
the parameter ![]() is the simulation time in seconds. The value
is the simulation time in seconds. The value
![]() indicates the time that source
indicates the time that source ![]() stops transmitting data.
These optimum rates provide a baseline to compare the rates calculated by
the RBCC scheme.
stops transmitting data.
These optimum rates provide a baseline to compare the rates calculated by
the RBCC scheme.
| Time |
Optimum Rate (bps) | |||
| Source 5 | Source 7 | Source 8 | Source 6 | |
| 64,000 | ||||
| 32,000 | 32,000 | |||
| 31,168.8 | 31,168.8 | 62,337.7 | ||
| 20,779.2 | 20,779.2 | 62,337.7 | 20,779.2 | |
|
|
31,168.8 | 31,168.8 | 62,337.7 | |
| 32,000 | 32,000 | |||
Packets are transmitted by a source in monotonically increasing sequence number, barring retransmissions, with the derivative of sequence number versus time giving the effective transmission rate of a source. Figure 21 show the sequence number for each packet transmitted by sources 5 and 6 using TCP Reno, TCP Vegas and TRUMP.
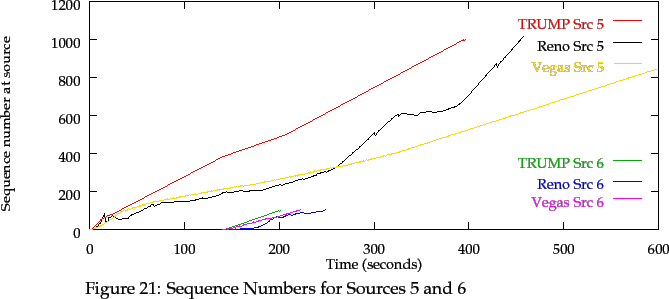
TRUMP's sequence numbers rise smoothly, controlled by the rate values calculated by RBCC. Reno's rate is much more jagged, caused by its window size changes which reflect packets lost by the destination. Note in particular the early rate fluctuation for Reno's source 5. Vegas' rate is much smoother than Reno's, and its startup is much better behaved than Reno's: however, Vegas' source 5 does not detect that source 6 has terminated at time 222, and so its throughput is even worse than Reno source 5.
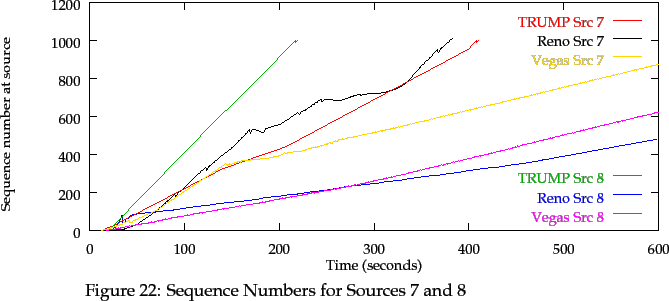
The plot for sources 7 and 8, Figure 22, shows similar characteristics. Both TCP Reno and Vegas transmits packets for source 8 (the reverse data flow) at a much slower rate than TRUMP/RBCC. This is surprising, given the fact that in this scenario TRUMP/RBCC did not lose any packets whatsoever: there must have been adequate bandwidth for source 8 which was not used by both Reno and Vegas.
In Scenario 2, TRUMP sources do not lose any packets whatsoever. Reno's sources, on the other hand, continually lose packets throughout the life of their transmission. Most packet losses are at the beginning of the data flow (until the optimum window size is reached), and Reno slowly loses packets after that as it tries to open its sliding window to take advantage of any new excess bandwidth. Reno loses 108 packets in total. Figure 23 shows the cumulative packet losses by TRUMP, Vegas and Reno.
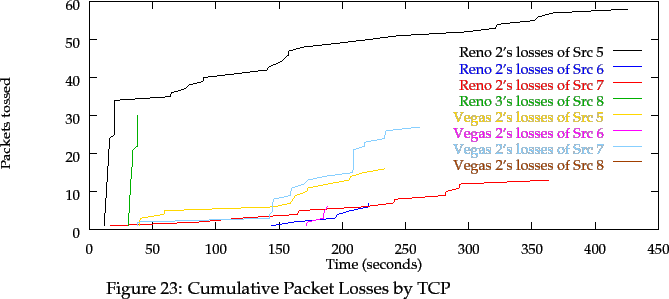
The Vegas improvements to TCP help reduce packet loss, with sources 5, 6 and 7 losing 16, 6 and 27 packets, respectively. This improvement seems more a result of the failure to utilise bandwidth after source 6 terminates, as against any real improvement to TCP.
In Scenario 2, routers 2 and 3 can only buffer 15,000 bytes (10 data packets). If the router cannot buffer the packet, it is immediately discarded (FCFS queueing and Drop Tail packet dropping are in use). Figure 24 shows the queue lengths (in packets) for router 2.
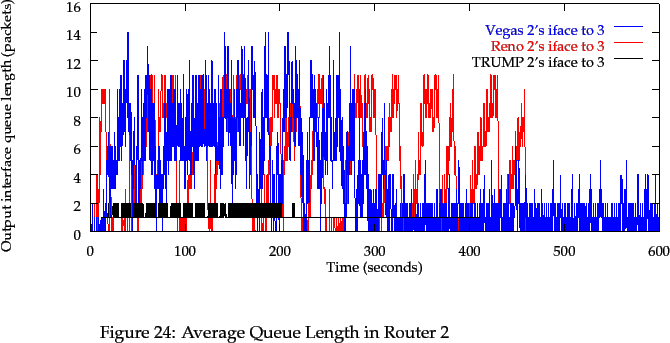
This plot is cluttered. For router 2, there are several peaks in queue length where Reno's excessive rate has caused lost packets, due to its window resizing mechanism. TRUMP/RBCC keeps the queue length for router 2 between 1 and 2 packets over the entire simulation. Vegas keeps average queue lengths below Reno's when source 6 is idle (due to poor bandwidth utilisation), but causes many peaks above queued packets when source 6 is transmitting.
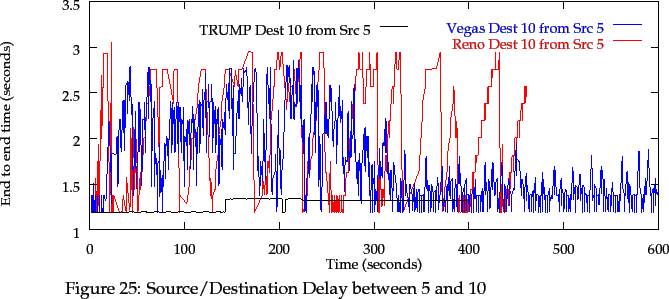
In Scenario 2, the end-to-end delay for a packet from source 5 must be at least 1.188 seconds, given the link latencies and packet propagation time. Figure 25 shows the measured end-to-end delay of source 5 for TCP Reno, TCP Vegas and TRUMP. TRUMP has an end-to-end delay between 1.19 and 1.34 seconds; Reno's value oscillates between 1.19 and 3.06 seconds, due to the oscillation of the queue size in router 2; Vegas shows faster oscillations which have a higher deviation than Reno's, although the average end-to-end delay is lower. The end-to-end delays for sources 6 and 7 show the same behaviour. The low end-to-end delay deviation exhibited by TRUMP/RBCC is particularly suited for time-sensitive data such as real-time voice or video transmission.
A summary of per-source results for TRUMP, Vegas and Reno is given below.
| Source | End | Avg | End to end | Round-trip | Pkts | |||
| Node | Time | Rate | Avg | S.Dev | Avg | S.Dev | Lost | Retx'd |
| TRUMP 5 | 396.6 | 30597 | 1.28 | 0.07 | 2.32 | 0.07 | 0 | 6 |
| Vegas 5 | 598.4 | 23843 | 1.77 | 0.45 | 2.01 | 0.74 | 16 | 342 |
| Reno 5 | 457.9 | 29037 | 2.06 | 0.59 | 3.00 | 0.47 | 58 | 89 |
| TRUMP 6 | 201.6 | 20989 | 1.25 | 0.00 | 2.35 | 0.06 | 0 | 4 |
| Vegas 6 | 222.3 | 24641 | 2.30 | 0.41 | 2.27 | 0.95 | 6 | 63 |
| Reno 6 | 248.8 | 12905 | 2.01 | 0.65 | 2.98 | 0.52 | 7 | 12 |
| TRUMP 7 | 410.2 | 30633 | 1.21 | 0.02 | 2.25 | 0.07 | 0 | 11 |
| Vegas 7 | 599.9 | 29477 | 1.72 | 0.48 | 1.80 | 1.19 | 27 | 569 |
| Reno 7 | 383.3 | 33322 | 2.19 | 0.58 | 3.15 | 0.47 | 13 | 17 |
| TRUMP 8 | 219.5 | 60841 | 1.19 | 0.00 | 2.33 | 0.07 | 0 | 11 |
| Vegas 8 | 599.8 | 27248 | 1.37 | 0.18 | 0.80 | 0.21 | 0 | 698 |
| Reno 8 | 598.4 | 10628 | 1.38 | 0.41 | 2.63 | 0.43 | 30 | 33 |
Note that end-to-end and round-trip deviation for TRUMP is generally lower then Reno's and Vegas'. TRUMP's average data rate is higher than Reno's and Vegas', and although Vegas loses fewer packets than Reno, it retransmits substantially more packets than TRUMP or Reno.
Another indication of network congestion, closely tied to average queue lengths, is the utilisation of a link. Together with the queue lengths, the link utilisation shows whether an output link is underloaded or overloaded.
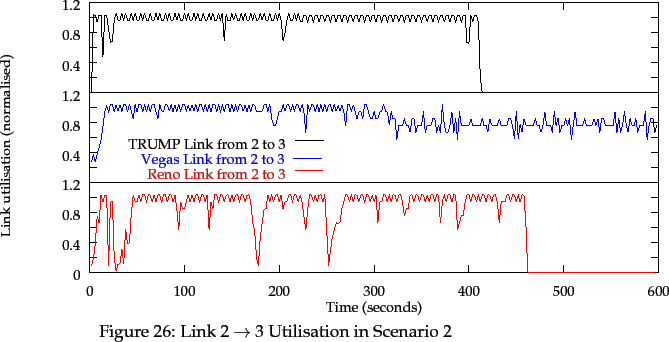
Figure 26 shows the utilisation of the link in the direction of router 2 to router 3 for TCP Reno, TCP Vegas and TRUMP/RBCC. TRUMP fully utilises the link, with occasional dips due to rate recalculations as sources start and stop. Vegas performs nearly as well, but with utilisation falling off after source 6 terminates. Reno shows many dips due to window shutdown. The average utilisation for TRUMP, Vegas and Reno is 0.97, 0.87 and 0.83, respectively.
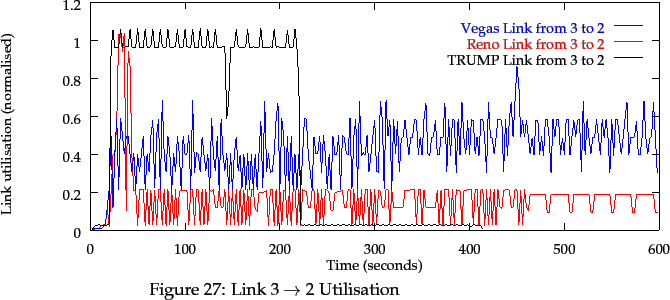
The utilisation of the link in the direction of router 3 to router 2 shows that TRUMP fully utilises the link while source 8 is transmitting, with only acknowledgment traffic passing over the link when source 8 stops. Both Vegas and Reno, on the other hand, never fully utilise this link with traffic from source 8, although Vegas makes around twice the utilisation of the link compared to Reno.
The optimum rates for TRUMP sources in Scenario 2 were given in Section 9.4.1. Figure 28 shows the actual rates returned from RBCC.
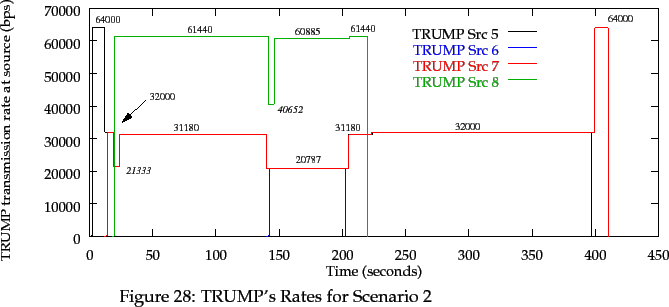
As can be seen, the rates used by the TRUMP sources match nearly exactly with the optimal rates. There are slight delays due to round-trips which cause the TRUMP sources to adopt new rates after the optimal time. Initial bit rates are correctly found after TRUMP's two-way connection handshake. The close correspondence between the optimum rates and RBCC's calculated rates indicates that RBCC's rate calculation method is successful, and fair to all traffic sources.
The comparison of TCP Reno, TCP Vegas and TRUMP/RBCC in Scenario 2 shows that TRUMP/RBCC gives quite different traffic characteristics to both TCP versions, with much less network congestion. RBCC determines source rates which will fully utilise output interfaces (where possible), while maintaining very low output queue sizes in routers. This has the effect of preventing long-term congestion, minimising buffering delays and gives end-to-end delays a very low variance, which is ideal for time-sensitive traffic. The rates calculated by RBCC are quite close to the optimum rates for Scenario 2.
Scenario 2 was modified to limit the desired transmission rates of flow
6 ![]() 11 to 18,000 bps, and flow 7
11 to 18,000 bps, and flow 7 ![]() 12 to
32,000 bps. As with Scenario 2, the optimum transmission rates can be
calculated:
12 to
32,000 bps. As with Scenario 2, the optimum transmission rates can be
calculated:
| Time |
Optimum Rate (bps) | |||
| Source 5 | Source 7 | Source 8 | Source 6 | |
| 64,000 | ||||
| 32,000 | 32,000 | |||
| 31,168.8 | 31,168.8 | 62,337.7 | ||
| 22,168.8 | 22,168.8 | 62,337.7 | 18,000 | |
|
|
31,168.8 | 31,168.8 | 62,337.7 | |
| 32,000 | 32,000 | |||
Although flow 7 ![]() 12 is bandwidth limited and flow 5
12 is bandwidth limited and flow 5 ![]() 10 is not, they should be treated equally when 7
10 is not, they should be treated equally when 7 ![]() 12 is allocated
a rate of 32,000 bps or less.
12 is allocated
a rate of 32,000 bps or less.
The rates calculated by the distributed RBCC algorithms are:
| Time |
ABT Allocated Rate (bps) | |||
| (seconds) | Source 5 | Source 7 | Source 8 | Source 6 |
| 2.02 | 64000.0 | |||
| 14.15 | 32000.0 | 32000.0 | ||
| 22.94 | 31180.0 | 31180.0 | 61440.0 | |
| 148.3 | 22180.0 | 22180.0 | 60960.0 | 18000.0 |
| 215.2 | 32000.0 | 32000.0 | 61440.0 | |
Again, the rates set by RBCC are very close to the optimum rates. As well, the bandwidth limited flows do not have their desired rates exceeded, and they are treated equally to the other flows when bandwidth must be shared.
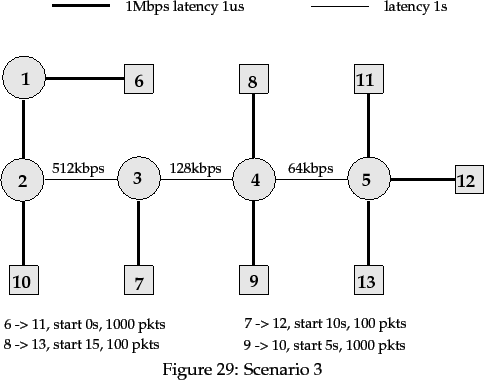
Scenario 3 is shown in Figure 29:
This scenario is designed to see how well existing traffic sources react
to other
sources starting and stopping. The three low-speed links have very long
latencies, and different capacities from each other. Three traffic flows
are from left to right, and the 9 ![]() 10 flow is from right to
left. The start times for successive sources is close to the longest
round-trip time.
10 flow is from right to
left. The start times for successive sources is close to the longest
round-trip time.
In Scenario 3, the TCP Reno sources 6 and 9 exhibit an exponentially increasing sequence number curve (and hence data rate curve). Both TRUMP's and Vegas' sequence number curves are linear. Note that Vegas' source 6 has not finished transmitting at time 2000 seconds. The per-source summary table below gives the end times and average data rates for all sources.
| Source | End | Avg | End to end | Round-trip | Pkts | |||
| Node | Time | Rate | Avg | S.Dev | Avg | S.Dev | Lost | Retx'd |
| TRUMP 6 | 244.1 | 52077 | 3.41 | 0.31 | 6.44 | 0.33 | 0 | 33 |
| Vegas 6 | 11919 | 3.41 | 0.14 | 2.10 | 0.27 | 0 | 1055 | |
| Reno 6 | 361.6 | 34811 | 4.07 | 0.56 | 7.04 | 0.51 | 3 | 5 |
| TRUMP 7 | 72.7 | 22359 | 3.18 | 0.23 | 5.23 | 0.23 | 0 | 9 |
| Vegas 7 | 179.1 | 14762 | 2.58 | 0.36 | 1.80 | 0.56 | 0 | 106 |
| Reno 7 | 141.3 | 10324 | 3.25 | 0.47 | 5.15 | 0.49 | 4 | 6 |
| TRUMP 8 | 75.5 | 21538 | 2.24 | 0.15 | 3.24 | 0.15 | 0 | 5 |
| Vegas 8 | 53.5 | 35498 | 1.82 | 0.42 | 2.70 | 0.51 | 0 | 3 |
| Reno 8 | 243.5 | 35558 | 1.98 | 0.49 | 2.60 | 0.39 | 21 | 27 |
| TRUMP 9 | 112.9 | 120597 | 2.12 | 0.00 | 4.15 | 0.04 | 0 | 43 |
| Vegas 9 | 1403.7 | 18351 | 2.17 | 0.05 | 1.32 | 0.28 | 0 | 1137 |
| Reno 9 | 192.7 | 66890 | 2.15 | 0.05 | 4.16 | 0.10 | 0 | 1 |
TRUMP/RBCC and Vegas lose no packets, whereas Reno does. Note, however, that Vegas exhibits a large number of retransmissions: this scenario seems to reveal a defect in Vegas' retransmission timer strategy. End-to-end and round-trip deviation is generally lower for TRUMP/RBCC than for either TCP version. TRUMP sources have higher transmission rates than their equivalent TCP sources.
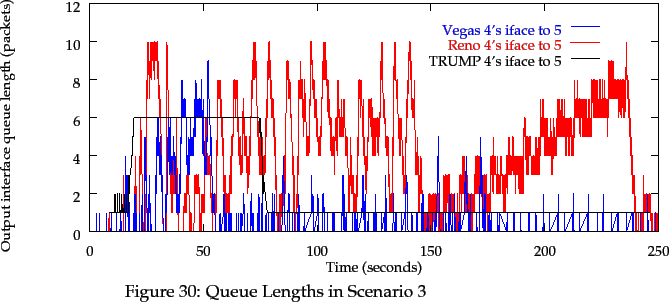
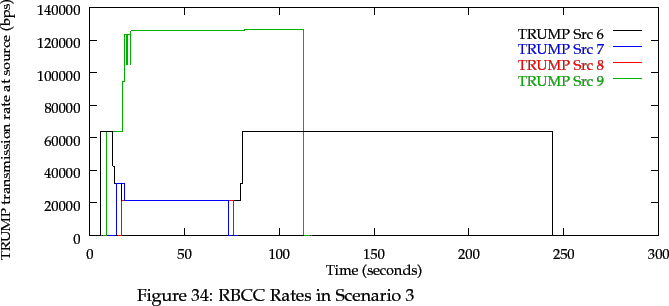
With TRUMP sources, no routers are congested except for router 4, as shown in Figure 30.
Its total buffer queue size for the 4 ![]() 5 link is above 2 packets
for time 17 to 76 seconds, spending most of the time at 6 packets queued.
5 link is above 2 packets
for time 17 to 76 seconds, spending most of the time at 6 packets queued.
With TCP Reno sources, the following routers are congested:
As with TCP Reno, the following routers are congested with TCP Vegas:
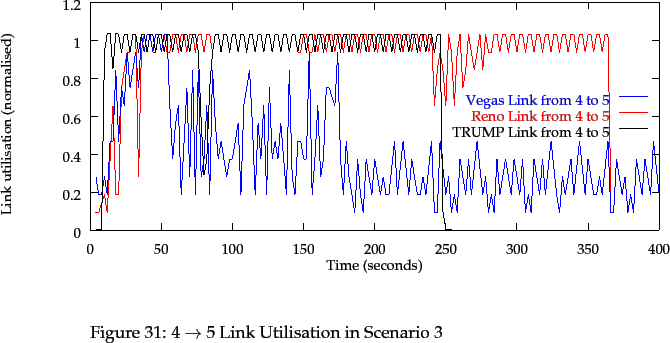
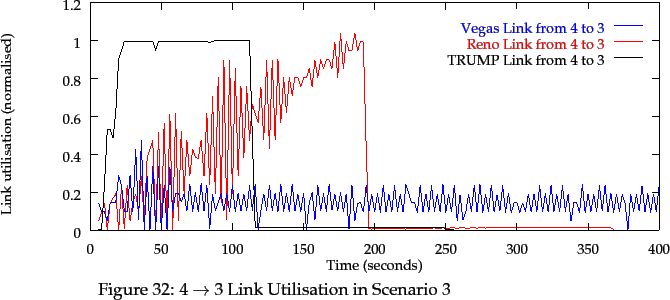
Utilisation of the links 4 to 5 and 4 to 3 are much better for TRUMP than for TCP, as shown in Figures 31 and 32. In fact, neither of the TCP versions make full use of the link from 4 to 3, and TCP Vegas has much poorer utilisation than TCP Reno.
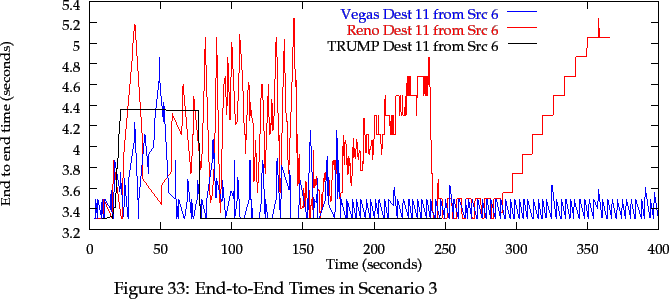
End-to-end times are smooth for TRUMP but not for TCP, as shown for source 6 in Figure 33. Average end-to-end times for TRUMP, Vegas and Reno are 3.41, 3.41, and 4.07 seconds, respectively. Note the large increase in TRUMP's end-to-end delay when router 4 has many packets queued.
Rates calculated by RBCC are also smooth and have no long-term oscillations. There are small fluctuations in individual rates when traffic flows start and stop, and this is due to the bandwidth-scaling congestion avoidance heuristic in RBCC's implementation.
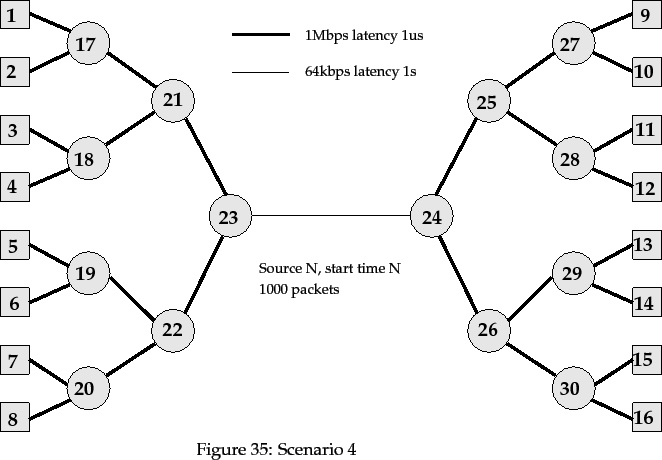
Scenario 4 is shown in Figure 35. This scenario is designed to see how well existing traffic sources react to other sources starting and stopping. Here, the links between routers 17 to 24 take turns being the main bottleneck at different times. The number of sources starting within such a short time should lead to short-term congestion.
For TRUMP, the main bottleneck is router 23, although router 21's buffers for the link to 23 peak at 2 packets at times 3 and 4. Router 23's packet buffer to 24 reaches 4 at times 5 and 6, but never exceeds 2 packets queued after time 8; this is shown in Figure 36.
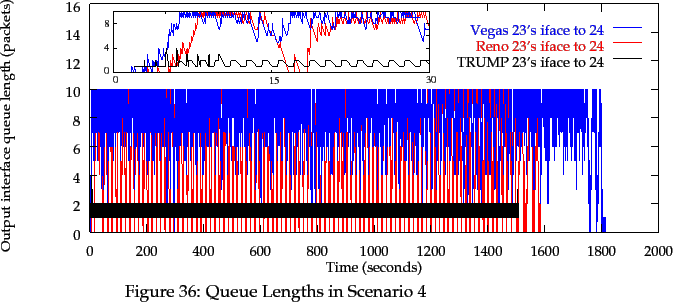
For TCP Reno, the only congested router is 23, and it remains in a severely congested state while any source is transmitting, again shown in Figure 36. The output buffer's queue size fluctuates between 1 and 10 packets, with an average queue length of 6.74 packets. Needless to say, there is a large amount of lost traffic; 782 packets are dropped, spread evenly over all sources. This is approximately 9% packet loss.
TCP Vegas also congests router 23 primarily, as shown in Figure 36, and to the same extent. Compared to Reno, Vegas loses 2,702 packets, spread evenly over all sources. This is approximately 34% packet loss.
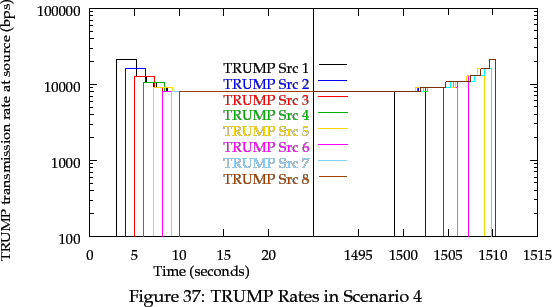
The transmission rates calculated by RBCC show a lovely smooth reduction
in each sources' rate as new sources begin to transmit, as shown in
Figure 37. The link 23 ![]() 24 is 99% utilised while
data transmission is in progress. End-to-end and round-trip times peak to
high values initially, and then settle down to near-constant values from
time 23 onwards, as is shown for source 6 in Figure 38.
24 is 99% utilised while
data transmission is in progress. End-to-end and round-trip times peak to
high values initially, and then settle down to near-constant values from
time 23 onwards, as is shown for source 6 in Figure 38.
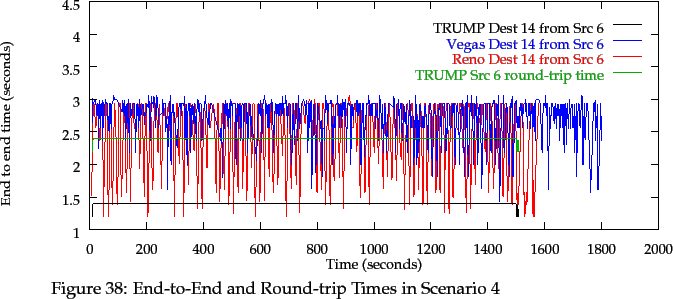
For TCP Reno and Vegas, the link 23 ![]() 24 is 93% and 99.7%
utilised while data transmission is in progress, respectively. End-to-end
and round-trip times are extremely peaky for all sources, as is shown
for source 6 in Figure 38.
24 is 93% and 99.7%
utilised while data transmission is in progress, respectively. End-to-end
and round-trip times are extremely peaky for all sources, as is shown
for source 6 in Figure 38.
A summary of per-source results for TRUMP, Vegas and Reno is given below. Again note that the averages and deviations for both end-to-end and round-trip times are lower for TRUMP than for the TCP flavours. As noted before, Vegas loses more packets than Reno; it also retransmits many more packets than either Reno or TRUMP.
| Source | End | Avg | End to end | Round-trip | Pkts | |||
| Node | Time | Rate | Avg | S.Dev | Avg | S.Dev | Lost | Retx'd |
| TRUMP 1 | 1497.6 | 8037 | 1.30 | 0.01 | 2.30 | 0.01 | 0 | 1 |
| Vegas 1 | 1782.2 | 10126 | 2.69 | 0.33 | 3.28 | 0.80 | 288 | 496 |
| Reno 1 | 1498.0 | 8962 | 2.43 | 0.56 | 3.33 | 0.26 | 106 | 112 |
| TRUMP 2 | 1501.0 | 8024 | 1.42 | 0.01 | 2.42 | 0.01 | 0 | 1 |
| Vegas 2 | 1736.5 | 10343 | 2.70 | 0.30 | 3.14 | 0.93 | 284 | 491 |
| Reno 2 | 1529.5 | 8720 | 2.44 | 0.54 | 3.36 | 0.24 | 101 | 106 |
| TRUMP 3 | 1503.1 | 8018 | 1.36 | 0.01 | 2.37 | 0.01 | 0 | 1 |
| Vegas 3 | 1609.0 | 11604 | 2.70 | 0.31 | 3.03 | 0.98 | 278 | 550 |
| Reno 3 | 1500.8 | 8941 | 2.42 | 0.58 | 3.31 | 0.23 | 104 | 110 |
| TRUMP 4 | 1504.7 | 8015 | 1.29 | 0.01 | 2.29 | 0.01 | 0 | 1 |
| Vegas 4 | 1756.0 | 9404 | 2.70 | 0.31 | 3.59 | 0.34 | 248 | 370 |
| Reno 4 | 1458.5 | 9067 | 2.46 | 0.54 | 3.36 | 0.21 | 94 | 95 |
| TRUMP 5 | 1506.2 | 8013 | 1.53 | 0.02 | 2.53 | 0.02 | 0 | 1 |
| Vegas 5 | 1816.2 | 9461 | 2.62 | 0.44 | 3.40 | 0.62 | 269 | 419 |
| Reno 5 | 1433.8 | 9213 | 2.44 | 0.57 | 3.32 | 0.20 | 94 | 95 |
| TRUMP 6 | 1508.2 | 8016 | 1.40 | 0.02 | 2.40 | 0.02 | 0 | 2 |
| Vegas 6 | 1800.7 | 9408 | 2.69 | 0.32 | 3.45 | 0.57 | 265 | 403 |
| Reno 6 | 1575.6 | 8456 | 2.43 | 0.55 | 3.34 | 0.30 | 96 | 96 |
| TRUMP 7 | 1508.9 | 8017 | 1.22 | 0.00 | 2.22 | 0.00 | 0 | 2 |
| Vegas 7 | 1757.8 | 9904 | 2.71 | 0.29 | 3.51 | 0.48 | 278 | 439 |
| Reno 7 | 1401.5 | 9397 | 2.44 | 0.56 | 3.34 | 0.17 | 90 | 90 |
| TRUMP 8 | 1509.5 | 8019 | 1.56 | 0.03 | 2.56 | 0.03 | 0 | 2 |
| Vegas 8 | 1796.0 | 11154 | 2.69 | 0.31 | 2.67 | 1.02 | 314 | 656 |
| Reno 8 | 1584.2 | 8458 | 2.37 | 0.59 | 3.33 | 0.36 | 97 | 97 |
Scenario 5 is shown in Figure 39. This simulation models a number of traffic flows, some of which flow across different sections of the 1M, 100k, 64k, 1M low-speed link. A congestion control scheme should not penalise one traffic flow for passing through more intermediary routers than another traffic flow.
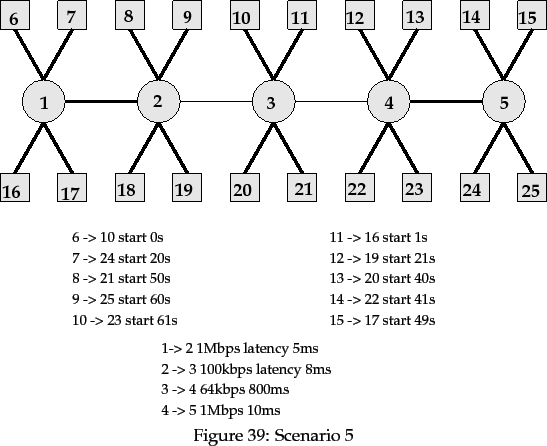
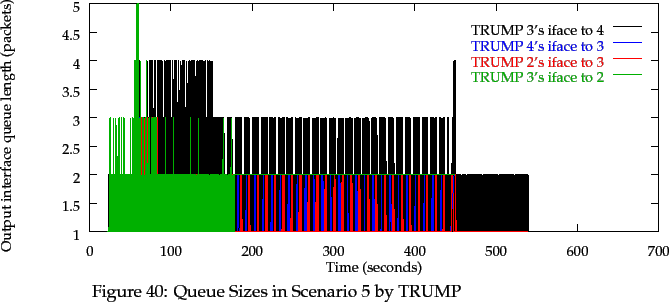
With TRUMP, several routers are congested at different times. Router 3 on the link to 2 has queue sizes above 2 from time 24 to 164, with three peaks to 5 packets queued around time 58. Router 2 on the link to 3 has short peaks to 3 packets queued from time 60 to 83. Router 4 on the link to 3 has two peaks to 3 packets queued at times 57 and 61. Router 3 on the link to 4 has peaks above 2 packets queued from time 61 to time 447. Some of these queue sizes are shown in Figure 40. No packets are lost by any RBCC routers.
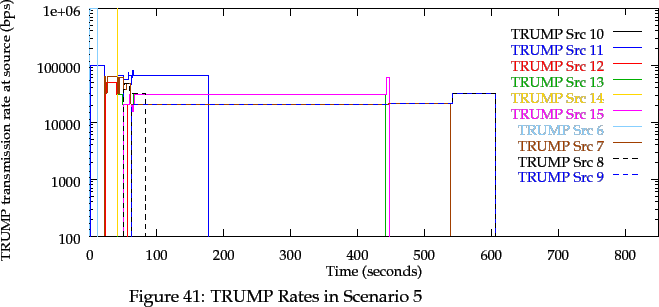
The rates calculated by RBCC are mostly smooth, with some small fluctuations for most sources during the times 20 to 80; these are due to the packet queue sizes crossing the RBCC threshold in some routers. The rates used by each TRUMP source are shown in Figure 41.
Average link utilisations for the low-speed links are given in the following table. The end-to-end times for TRUMP fluctuate a lot until time 80 and then show little deviation, except for sources 16 and 17. Round-trip times show some deviation for all sources at all times.
| Link | TRUMP | TCP Vegas | TCP Reno |
| 2 |
0.43 | 0.37 | 0.41 |
| 3 |
0.43 | 0.37 | 0.39 |
| 4 |
0.70 | 0.79 | 0.60 |
| 3 |
0.98 | 0.93 | 0.85 |
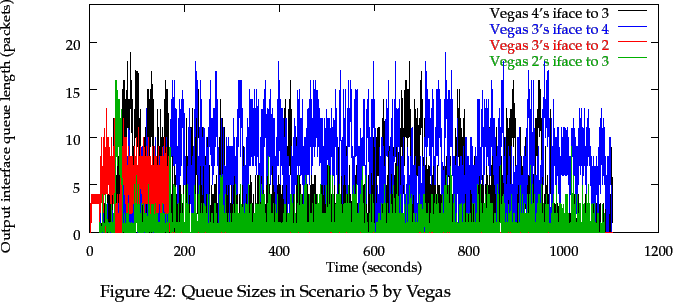
In Scenario 5, TCP Vegas exhibits severe congestion and packet loss in routers 1, 2, 3, 4 and 5, with long-term queue lengths above 10 packets, as shown in Figure 42. 140 packets were lost, mainly by routers 3 and 4, with sources 7, 9, 10 and 15 losing the majority.
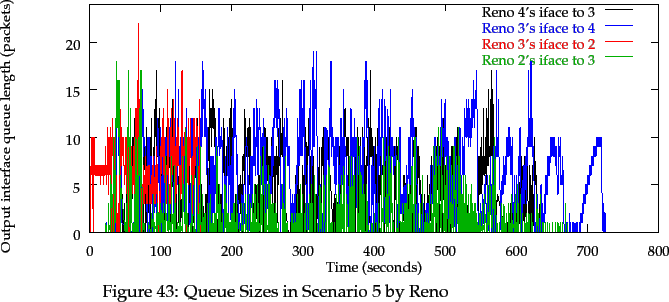
TCP Reno exhibits even worse congestion and packet loss in routers 1, 2, 3, 4 and 5 than Vegas, with long-term queue lengths also above 10 packets, as shown in Figure 43. 405 packets were lost, mainly by routers 3 and 4, with all sources except 16, 19, 20, 24 and 25 losing more than 10 packets.
The end times for all sources are given in the following table. Although some Vegas sources finish earlier than TRUMP (sources 8 and 11), many finish significantly later than TRUMP (sources 7, 9, 10, 12, 13 and 15). This demonstrates that TCP Vegas treats long-haul connections unfairly, giving more bandwidth to short round-trip time connections.
| Source | End | Avg | End to end | Round-trip | Pkts | |||
| Node | Time | Rate | Avg | S.Dev | Avg | S.Dev | Lost | Retx'd |
| TRUMP 6 | 12.1 | 997051 | 0.02 | 0.00 | 0.03 | 0.00 | 0 | 2 |
| Vegas 6 | 12.1 | 1000324 | 0.05 | 0.00 | 0.06 | 0.00 | 0 | 0 |
| Reno 6 | 16.0 | 780865 | 0.05 | 0.04 | 0.09 | 0.02 | 0 | 31 |
| TRUMP 7 | 539.1 | 23263 | 1.17 | 0.03 | 2.17 | 0.12 | 0 | 3 |
| Vegas 7 | 1086.5 | 13097 | 2.13 | 0.52 | 3.33 | 0.55 | 33 | 155 |
| Reno 7 | 671.4 | 20576 | 2.29 | 0.66 | 3.39 | 0.46 | 132 | 108 |
| TRUMP 8 | 83.3 | 36418 | 0.16 | 0.05 | 0.27 | 0.08 | 0 | 0 |
| Vegas 8 | 67.6 | 72338 | 0.80 | 0.28 | 0.95 | 0.11 | 0 | 0 |
| Reno 8 | 74.7 | 73494 | 0.61 | 0.34 | 1.09 | 0.15 | 30 | 39 |
| TRUMP 9 | 605.3 | 22205 | 1.43 | 0.13 | 2.38 | 0.21 | 0 | 5 |
| Vegas 9 | 1066.1 | 24940 | 2.08 | 0.48 | 1.33 | 0.77 | 37 | 1087 |
| Reno 9 | 604.8 | 23258 | 2.16 | 0.55 | 3.47 | 0.38 | 51 | 49 |
| TRUMP 10 | 605.8 | 22213 | 1.15 | 0.02 | 2.01 | 0.06 | 0 | 5 |
| Vegas 10 | 1102.6 | 24713 | 1.78 | 0.45 | 0.97 | 0.25 | 59 | 1135 |
| Reno 10 | 725.6 | 20312 | 1.81 | 0.57 | 2.86 | 0.46 | 65 | 114 |
| Source | End | Avg | End to end | Round-trip | Pkts | |||
| Node | Time | Rate | Avg | S.Dev | Avg | S.Dev | Lost | Retx'd |
| TRUMP 11 | 177.8 | 67973 | 0.19 | 0.04 | 0.25 | 0.08 | 0 | 1 |
| Vegas 11 | 170.5 | 71433 | 0.60 | 0.18 | 0.69 | 0.14 | 0 | 5 |
| Reno 11 | 156.3 | 81758 | 0.81 | 0.27 | 0.87 | 0.18 | 25 | 50 |
| TRUMP 12 | 56.4 | 37448 | 1.15 | 0.08 | 2.17 | 0.11 | 0 | 4 |
| Vegas 12 | 127.4 | 21318 | 2.25 | 0.50 | 1.98 | 1.34 | 5 | 85 |
| Reno 12 | 147.3 | 11398 | 2.31 | 0.54 | 3.53 | 0.46 | 21 | 17 |
| TRUMP 13 | 441.0 | 30220 | 0.99 | 0.01 | 2.02 | 0.12 | 0 | 5 |
| Vegas 13 | 976.0 | 27527 | 1.55 | 0.46 | 1.02 | 0.45 | 27 | 1141 |
| Reno 13 | 465.9 | 30150 | 1.66 | 0.51 | 3.10 | 0.37 | 31 | 60 |
| TRUMP 14 | 42.2 | 1008221 | 0.02 | 0.00 | 0.04 | 0.00 | 0 | 2 |
| Vegas 14 | 42.3 | 1003458 | 0.06 | 0.01 | 0.07 | 0.01 | 0 | 0 |
| Reno 14 | 49.6 | 934329 | 0.10 | 0.01 | 0.05 | 0.02 | 0 | 24 |
| TRUMP 15 | 448.2 | 30539 | 1.18 | 0.04 | 2.39 | 0.15 | 0 | 11 |
| Vegas 15 | 1105.2 | 24529 | 1.75 | 0.50 | 1.20 | 0.33 | 32 | 1152 |
| Reno 15 | 633.9 | 22035 | 1.87 | 0.58 | 3.45 | 0.39 | 73 | 67 |
Scenario 6 is shown in Figure 44:
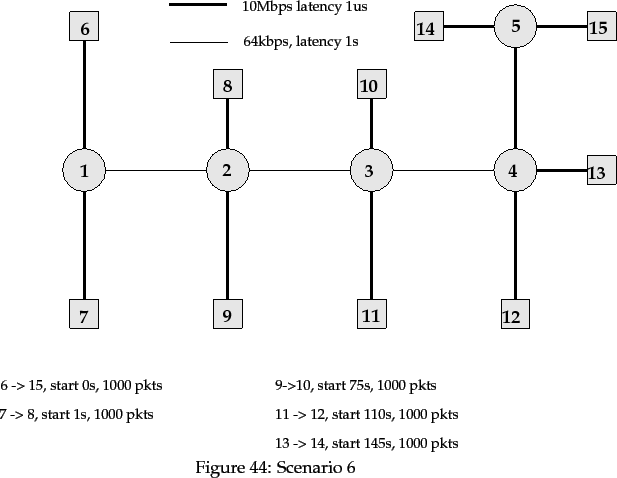
This scenario models a long-haul traffic flow, 6 ![]() 15, which
must compete against a number of short-haul cross-traffic flows.
The end times for all sources are given below.
15, which
must compete against a number of short-haul cross-traffic flows.
The end times for all sources are given below.
| Source | End | Avg | End to end | Round-trip | Pkts | |||
| Node | Time | Rate | Avg | S.Dev | Avg | S.Dev | Lost | Retx'd |
| TRUMP 6 | 315.0 | 40894 | 4.84 | 0.12 | 8.86 | 0.12 | 0 | 46 |
| Vegas 6 | 486.0 | 26246 | 4.93 | 0.39 | 8.88 | 0.75 | 1 | 20 |
| Reno 6 | 503.5 | 25191 | 5.18 | 0.44 | 9.17 | 0.35 | 11 | 14 |
| TRUMP 7 | 79.5 | 32157 | 1.19 | 0.00 | 2.20 | 0.00 | 0 | 5 |
| Vegas 7 | 100.4 | 41549 | 1.56 | 0.33 | 1.54 | 0.76 | 0 | 138 |
| Reno 7 | 1308.1 | 6610 | 1.33 | 0.39 | 2.62 | 0.47 | 0 | 63 |
| TRUMP 9 | 153.6 | 32157 | 1.19 | 0.00 | 2.19 | 0.00 | 0 | 5 |
| Vegas 9 | 168.5 | 44023 | 1.68 | 0.44 | 1.53 | 0.83 | 0 | 138 |
| Reno 9 | 151.2 | 36528 | 1.89 | 0.54 | 2.75 | 0.33 | 11 | 20 |
| TRUMP 11 | 189.0 | 32156 | 1.27 | 0.09 | 2.28 | 0.09 | 0 | 6 |
| Vegas 11 | 204.3 | 46296 | 1.54 | 0.29 | 1.34 | 0.72 | 0 | 155 |
| Reno 11 | 303.8 | 41912 | 1.53 | 0.38 | 2.42 | 0.39 | 19 | 31 |
| TRUMP 13 | 223.9 | 32156 | 1.37 | 0.09 | 2.37 | 0.09 | 0 | 6 |
| Vegas 13 | 201.9 | 45570 | 1.75 | 0.36 | 2.70 | 0.42 | 0 | 3 |
| Reno 13 | 632.5 | 17057 | 1.39 | 0.37 | 2.63 | 0.49 | 26 | 45 |
As can be seen, source 6 is penalised by both TCP versions because it is a long-haul traffic flow. The short-haul traffic flows end much faster in TCP Vegas than in TRUMP, indicating that they are favoured.
With TRUMP, the only congested link is 4 ![]() 5, with router 4's
queue oscillating between 1 and 2 packets queued from time 156 to time 224.
The transmission rates calculated by RBCC are smooth. End-to-end and
round-trip times for TRUMP/RBCC are surprisingly flat, despite the congestion.
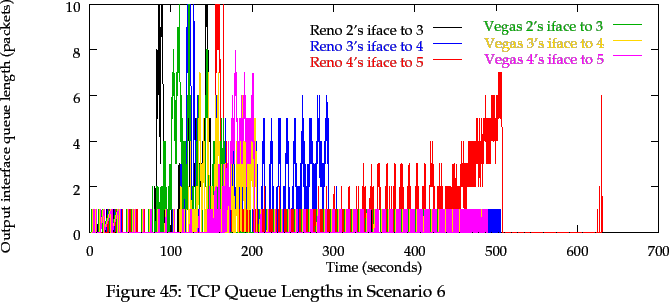
In comparison, TCP Reno and Vegas exhibit network congestion in several routers,
and some packets are lost; this is shown in Figure 45.
5, with router 4's
queue oscillating between 1 and 2 packets queued from time 156 to time 224.
The transmission rates calculated by RBCC are smooth. End-to-end and
round-trip times for TRUMP/RBCC are surprisingly flat, despite the congestion.
In comparison, TCP Reno and Vegas exhibit network congestion in several routers,
and some packets are lost; this is shown in Figure 45.
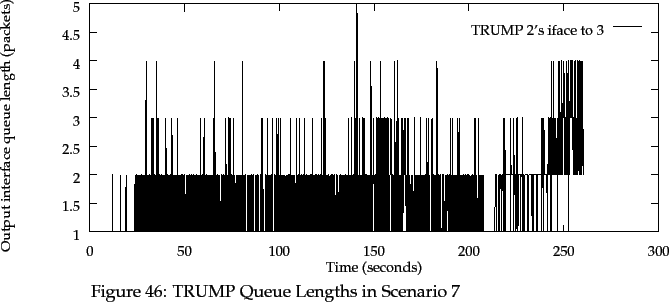
Scenario 7 is the same as Scenario 2. However, in this scenario, the traffic flows vary their packet sizes evenly across a range of sizes:
| Flow | Range |
| 5 |
[70:1500] |
| 6 |
[400:900] |
| 7 |
[700:1500] |
| 8 |
[900:1500] |
Unfortunately, the version of TCP Reno and TCP Vegas that are available in REAL 4.0 do not have the ability to alter their packet sizes on the fly, so no comparisons can be drawn with TRUMP/RBCC and TCP in this scenario.
The usual per-source results for Scenario 7 are given in the following table.
| Source | End | Avg | End to end | Round-trip | Pkts | |||
| Node | Time | Rate | Avg | S.Dev | Avg | S.Dev | Lost | Retx'd |
| TRUMP 5 | 207.2 | 58939 | 1.16 | 0.07 | 2.20 | 0.09 | 0 | 8 |
| TRUMP 6 | 168.2 | 49679 | 1.19 | 0.07 | 2.22 | 0.08 | 0 | 8 |
| TRUMP 7 | 260.1 | 49606 | 1.20 | 0.06 | 2.26 | 0.08 | 0 | 17 |
| TRUMP 8 | 274.4 | 47842 | 1.15 | 0.02 | 2.28 | 0.08 | 0 | 13 |
Packet loss is nonexistent, and end-to-end and round-trip deviation is low. Packet queue lengths in the bottleneck router is higher than for Scenario 2, and fluctuates more, as shown in Figure 46. This is a consequence of the sizes and earlier arrival times for the smaller packets. This scenario shows that a congestion avoidance mechanism which relies simply on the number of packets queued will sometimes incorrectly perceive congestion.
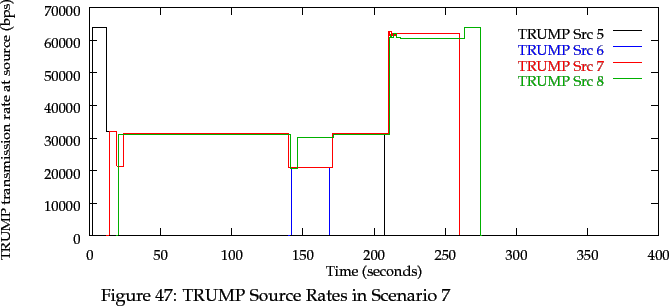
The effect of the small packets and the larger router queue sizes has little effect on the transmission rates passed back by RBCC to the traffic sources, as shown in Figure 47. The rate are, as usual, stable, but with a number of dips where the RBCC congestion avoidance mechanism has fired. Link utilisation is essentially unchanged from Scenario 2.
Scenario 8 is shown in Figure 48.
This is similar to Scenario 2, but there is an extra router, 13, and two
extra links which connect router 13 to routers 1 and 3. Initially,
the new links and router are not used. At time 100, router 1 changes its
routing table to forward packets for destination 10 via router 13. This
affects the data flow of source 5. The new route via router 13
offers more bandwidth than the original route
(1 ![]() 2
2 ![]() 3).
3).
As flow 6 ![]() 11 doesn't come online until time 140, only the flows
from sources 5, 7 and 8 are affected at the route change time of 100 seconds.
The route change gives the flow 5
11 doesn't come online until time 140, only the flows
from sources 5, 7 and 8 are affected at the route change time of 100 seconds.
The route change gives the flow 5 ![]() 10 much more bandwidth;
it should be able to use the full 512kbps across links
10 much more bandwidth;
it should be able to use the full 512kbps across links
(1 ![]() 13
13 ![]() 3). Flow 7
3). Flow 7 ![]() 12 should
then be able to use the bandwidth previously used by flow 5
12 should
then be able to use the bandwidth previously used by flow 5 ![]() 10.
Let us examine the route change on TRUMP, Vegas and Reno in turn.
10.
Let us examine the route change on TRUMP, Vegas and Reno in turn.
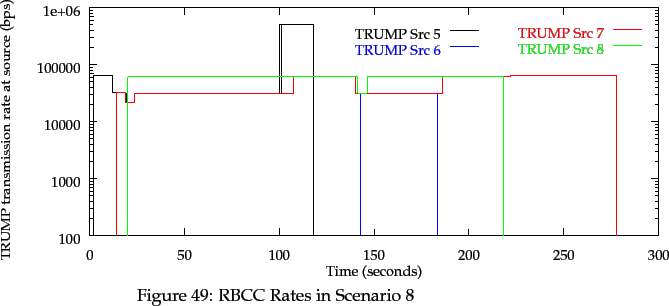
The first TRUMP data packet from source 5 that crosses the new route has its
Rate field updated with the new bandwidth, and this value reaches
source 5 at time 100.24. The new rate calculated by RBCC is exactly 512kbps.
Router 2 detects the lost of flow 5 ![]() 10 at time 105.0, as
described in Section 8.4. It calculates a new rate for source 7,
which it receives at time 107.6. The new rate is 62,361bps, which provides for
the acknowledgments of flow 8
10 at time 105.0, as
described in Section 8.4. It calculates a new rate for source 7,
which it receives at time 107.6. The new rate is 62,361bps, which provides for
the acknowledgments of flow 8 ![]() 9. The rates calculated by RBCC
are shown in Figure 49.
9. The rates calculated by RBCC
are shown in Figure 49.
TCP Vegas begins to open its window, prompted by round-trip time reductions, at time 100.4, and Reno begins to open its window at time 101.1, as shown in Figure 50.
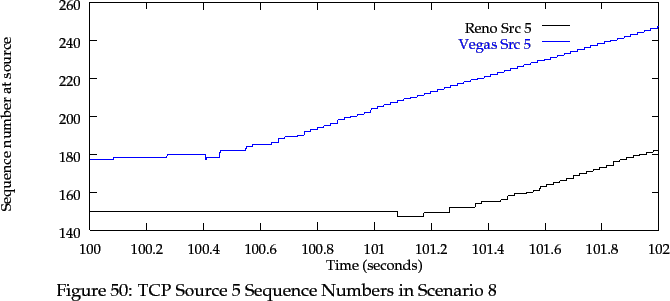
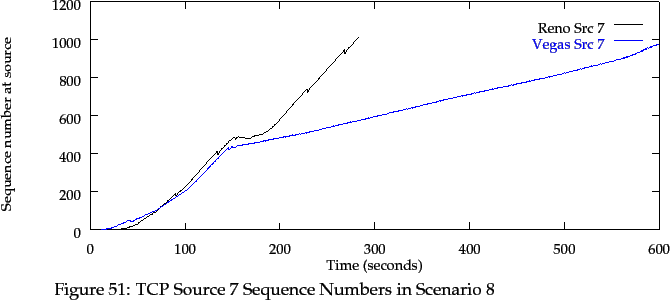
What is difficult to explain is the apparent transmission rate of source 7 in both TCP Vegas and Reno. Optimally, source 7's rate should double at the route change time of 100 seconds, halve when source 6 comes online at time 140 seconds, and redouble when source 6 finishes transmission. Reno appears to show this behaviour, as seen in the sequence number diagram in Figure 51; however, the initial rate is kept low by the Slow Start mechanism. Vegas seems to reach a stable rate just before time 50 seconds, increases its rate after the route change, slows down in response to source 6, but then never regains its original rate once source 6 finishes transmitting. This behaviour was also seen in Scenario 2, and appears to be a problem in TCP.
The following table gives the per-flow results for Scenario 8. Overall, source 5 goes faster for Vegas than TRUMP/RBCC, but Vegas loses packets. Despite a 5-second delay to detect the route change by router 2, TRUMP's source 7 still achieves a higher rate than either TCP, with no packet loss. And as with Scenario 2, source 8 achieves a much higher rate with TRUMP than either version of TCP.
| Source | End | Avg | End to end | Round-trip | Pkts | |||
| Node | Time | Rate | Avg | S.Dev | Avg | S.Dev | Lost | Retx'd |
| TRUMP 5 | 118.2 | 103793 | 0.42 | 0.56 | 0.74 | 1.03 | 0 | 5 |
| Vegas 5 | 119.8 | 110008 | 0.56 | 0.79 | 0.50 | 0.80 | 5 | 91 |
| Reno 5 | 121.3 | 107848 | 0.53 | 0.74 | 0.56 | 0.86 | 88 | 77 |
| TRUMP 6 | 182.7 | 31465 | 1.49 | 0.02 | 2.58 | 0.06 | 0 | 6 |
| Vegas 6 | 224.3 | 33892 | 2.07 | 0.45 | 1.02 | 0.46 | 4 | 134 |
| Reno 6 | 179.9 | 37852 | 1.80 | 0.54 | 2.64 | 0.34 | 7 | 12 |
| TRUMP 7 | 275.9 | 46344 | 1.22 | 0.06 | 2.30 | 0.09 | 0 | 11 |
| Vegas 7 | 599.7 | 33201 | 1.57 | 0.40 | 1.68 | 1.12 | 7 | 647 |
| Reno 7 | 283.1 | 45282 | 2.03 | 0.59 | 2.98 | 0.49 | 7 | 8 |
| TRUMP 8 | 218.1 | 61402 | 1.19 | 0.00 | 2.38 | 0.10 | 0 | 12 |
| Vegas 8 | 484.6 | 38266 | 1.51 | 0.23 | 1.95 | 0.94 | 0 | 474 |
| Reno 8 | 599.1 | 11688 | 1.35 | 0.39 | 2.63 | 0.43 | 30 | 33 |
Scenario 9 is a modification to Scenario 6 (Figure 44), but
with the 7 ![]() 8 cross-flow starting at time 10, after source 6
learns of its initial rate. The links 1 to 4 impose a 3-second delay in the
feedback of rate information to source 6 from its destination.
8 cross-flow starting at time 10, after source 6
learns of its initial rate. The links 1 to 4 impose a 3-second delay in the
feedback of rate information to source 6 from its destination.
Section 7.1 suggests that, although selective acknowledgments lower the network load due to acknowledgment traffic, the effect of acknowledgment delays may induce higher network congestion. This scenario examines the effect of large selective acknowledgment sizes, combined with Rate Quenches, on the framework.
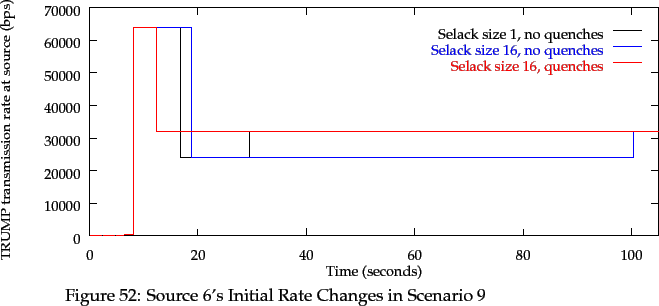
Figure 52 shows the rates used by TRUMP for source 6, for several selective acknowledgment sizes and Rate Quench combinations. For all three plots, source 6 obtains an initial rate at time 8 seconds.
The black plot shows source 6 using a selective acknowledgment size of 1, with no Rate Quenches being generated by the network. Source 7 starts at time 10, and requires some of the bandwidth in use by source 6. RBCC recalculates a new rate for source 6, and this arrives at the source at time 16.8 seconds. Because of the large round-trip time, the packet queue in router 1 exceeds the congestion avoidance threshold at time 13.6 seconds, and two packets for source 6 are lost around time 16 seconds. The link-delayed new rate for source 6 arrives at the source at time 17 seconds, and has been scaled by 0.75 by the network's congestion avoidance scheme. It is only after router 1's queues have fallen, at time 29, that source 6 receives its RBCC rate allocation unscaled.
The blue plot shows source 6's operation with a selective acknowledgment of 16, with no Rate Quenches being generated by the network. The effect of the larger acknowledgment size is to delay the reception of a new rate for source 6 until time 19 seconds. Again, because of router queue sizes, this has been scaled by the network's congestion avoidance scheme. The time until the avoidance scheme terminates scaling is also delayed, both by the selective acknowledgment delays and by the time to drain router 1's buffers.
The red plot shows source 6's operation with a selective acknowledgment of 16, and with Rate Quenches being generated by the network. The effect of Rate Quenches is dramatic. A new rate for source 6 is returned at time 12 seconds, and is not scaled as the buffer occupancy in router 1 has not exceed the congestion avoidance threshold.
Scenario 9 shows that high round-trip times do slow the congestion framework's
reaction time, and delays due to large selective acknowledgment sizes increases
this reaction time further. Rate Quenches appear to be a useful mechanism to
circumvent these delays.
The simulation of nine hand-crafted network scenarios in this chapter show that the proposed rate-based congestion framework, with TRUMP and RBCC as component functions, appears to work very well at congestion control. Let us review the congestion characteristics for both TRUMP/RBCC and for the two flavours of TCP.
Overall, TRUMP loses no packets in any of the scenarios. Vegas loses many fewer packets than Reno, except for Scenario 4 where Vegas loses over 3 times as many packets as Reno. However, Vegas and Reno loses 2,956 and 1,563 packets, respectively. On this basis alone, TRUMP/RBCC provides better congestion control than TCP.
The amount of packet retransmission varies greatly between scenarios, but in general TRUMP's level of packet retransmission is roughly of the same magnitude as TCP Reno's. Vegas, on the other hand, appears to aggressively retransmit packets, which indicates that its timeout strategy is still incorrect. Note that TRUMP does not retransmit packets because of packet losses: instead, it lazily retransmits packets until their acknowledgments are received. This is done to avoid setting a round-trip timer when there is no new data to transmit.
TRUMP/RBCC generally keeps router queue lengths down around 1 or 2 packets, except where new traffic flows came on line: the delay to return new sustainable rates to all traffic flows allows router queue lengths to grow. The primitive `threshold' congestion avoidance scheme in RBCC is adequate to bring the queue levels back down to 1 or 2 packets. In contrast, both TCP versions keep queue lengths in bottleneck routers above 2 packets most of the time. This adds to the delay of packet transmission, and makes each router more susceptible to short-term congestion which fills the remaining buffer space and causes lost packets. On the basis of router queue lengths, TRUMP/RBCC appears to give good congestion control.
The higher router queue lengths in TCP increases the average end-to-end and round-trip times for traffic flows. Due to the lower router queue lengths in TRUMP/RBCC, average end-to-end and round-trip times are also lower. The `bursty' window size increases made by both TCP flavours increases router queue lengths in the short-term, which adds variance to end-to-end and round-trip times. Ironically, this in turn makes TCP's round-trip time estimation more difficult. Not only does TRUMP/RBCC not require a round-trip timer, but its Leaky Bucket packet admission works to reduce variance in end-to-end and round-trip times.
Although this feature is not directly related to congestion control, it is a boon to applications such as voice and video transmission where low end-to-end time variance is desired.
RBCC appears to derive near-optimal transmission rates for all traffic sources. This keeps `bottleneck' links operating at near 100% utilisation. TCP's Slow Start and bandwidth-probing strategies either keeps bottleneck links operating either below their capacity, or offers too much load for links to transmit. The result is either poor utilisation or packet loss. As well, for some scenarios, TCP did not probe and find extra bandwidth when it became available. The reason for this behaviour is unknown.
Finally, the proposed congestion control framework, with TRUMP and RBCC as component functions, was able to cope with finite desired rates from traffic sources, ranges of packet sizes from sources, and low-frequency route changes.